Introducing DeepFeatTimeGPT
The field of financial forecasting has long been dominated by
traditional methods like linear regression models, spreadsheets,
and manual work. However, recent advancements in deep learning
have opened up new possibilities for more accurate and efficient
forecasting.
traditional methods like linear regression models, spreadsheets,
and manual work. However, recent advancements in deep learning
have opened up new possibilities for more accurate and efficient
forecasting.
One such innovation is DeepFeatTimeGPT, a multimodal,
probabilistic forecasting system based on a neural network
architecture.
probabilistic forecasting system based on a neural network
architecture.
What Sets DeepFeatTimeGPT
Apart
DeepFeatTimeGPT stands out because of its ability to
incorporate multiple data sources and modalities. The
neural network can analyze both structured and
unstructured data to generate more accurate predictions.
incorporate multiple data sources and modalities. The
neural network can analyze both structured and
unstructured data to generate more accurate predictions.
Moreover, the system is probabilistic, providing a range of
possible outcomes and their associated probabilities, rather
than a single-point estimate, thereby accounting for uncertainty.
possible outcomes and their associated probabilities, rather
than a single-point estimate, thereby accounting for uncertainty.
The Training Data
DeepFeatTimeGPT is built on a massive dataset consisting of
nearly 1 billion months of financial history from 1,500,000
companies in 47 sectors and 744 industries across 100
countries. This data includes 78 different measures, such
as revenue, EBITDA, gross margin, and enterprise value.
nearly 1 billion months of financial history from 1,500,000
companies in 47 sectors and 744 industries across 100
countries. This data includes 78 different measures, such
as revenue, EBITDA, gross margin, and enterprise value.
To put this into perspective, it would take a human over 72 years
of nonstop reading 24/7 to go through all the data. Assuming an
average of 1,716 hours of work per year, it would take about 371
working years to read through the dataset.
of nonstop reading 24/7 to go through all the data. Assuming an
average of 1,716 hours of work per year, it would take about 371
working years to read through the dataset.
If a consulting firm charged $250 per hour to do this research,
the cost would be approximately $159,225,000. This cost only
accounts for the time spent reading the data and does not include
understanding and interpreting the information.
the cost would be approximately $159,225,000. This cost only
accounts for the time spent reading the data and does not include
understanding and interpreting the information.
Benchmarking Study
To assess the effectiveness of DeepFeatTimeGPT compared
to traditional methods used by business strategy consultants
or investment banks, we conducted a benchmarking study using
a dataset of published forecasts by investment banks. The dataset
includes forecasts for three central financial metrics:
to traditional methods used by business strategy consultants
or investment banks, we conducted a benchmarking study using
a dataset of published forecasts by investment banks. The dataset
includes forecasts for three central financial metrics:
- Revenue: Total money earned from sales of products
or services. - EBITDA (Earnings Before Interest, Taxes, Depreciation,
and Amortization): Measures operating performance by
subtracting operating expenses from revenue. - EBT (Earnings Before Taxes): Measures operating performance
by subtracting all operating expenses, including depreciation and
amortization, from revenue but before taxes.
The dataset consists of 407,500 data points for 11,443 public
companies across 70 countries, 47 sectors, and 209 industries.
The number of investment banks included ranges from 2 to 49, with
a median of 12. Each forecast is provided for four quarters into the
future, with data ranging from Q1/1992 to Q4/2022.
companies across 70 countries, 47 sectors, and 209 industries.
The number of investment banks included ranges from 2 to 49, with
a median of 12. Each forecast is provided for four quarters into the
future, with data ranging from Q1/1992 to Q4/2022.
The forecasts are constructed as 95% confidence intervals with
expected (median), lower (5%), and upper (95%) values. To evaluate
DeepFeatTimeGPT’s performance, we created several subsets for
analysis, including all 11,443 companies and a subset of S&P 500 firms.
expected (median), lower (5%), and upper (95%) values. To evaluate
DeepFeatTimeGPT’s performance, we created several subsets for
analysis, including all 11,443 companies and a subset of S&P 500 firms.
The included investment banks in the study can be found below:
Investment Bank Name
Website
Cowen & Co
D.A. Davidson
Rosenblatt Securities
Wedbush
Barclays
KeyBanc
Deutsche Bank
J.P. Morgan
Loop Capitals Market
Piper Sandler
BNB Paribas
Morgan Stanley
Tigress Financial
Goldman Sachs
Credit Suisse
Needham
Newstreet
Citigroup
Evercore ISI
Evaluation Metrics for
DeepFeatTimeGPT
We evaluated the performance of DeepFeatTimeGPT using two
central performance measures for forecasting: sMAPE and
coverage.
central performance measures for forecasting: sMAPE and
coverage.
sMAPE (Symmetric Mean
Absolute Percentage Error)
sMAPE is an accuracy measure based on percentage errors.
It is calculated as the mean of the absolute differences between
the actual and predicted values, divided by the sum of the absolute
values of the actual and predicted values, multiplied by 200%. The
median forecast is used for calculating the sMAPE.
It is calculated as the mean of the absolute differences between
the actual and predicted values, divided by the sum of the absolute
values of the actual and predicted values, multiplied by 200%. The
median forecast is used for calculating the sMAPE.
Coverage
Coverage refers to the proportion of times that a prediction
interval contains the actual outcome. A prediction interval is
a range of values that an event or outcome is expected to fall
within with a certain degree of probability. In probabilistic forecasting,
coverage is an important metric for assessing the accuracy and
reliability of the forecast model.
interval contains the actual outcome. A prediction interval is
a range of values that an event or outcome is expected to fall
within with a certain degree of probability. In probabilistic forecasting,
coverage is an important metric for assessing the accuracy and
reliability of the forecast model.
Evalutation Setting
DeepFeatTimeGPT is evaluated through zero-shot testing,
meaning that the model is tested on a data series it has not
encountered previously. During the benchmark study, the
model sees the data from the companies for the first time.
meaning that the model is tested on a data series it has not
encountered previously. During the benchmark study, the
model sees the data from the companies for the first time.
The purpose of this approach is to evaluate the model’s ability
to generalize to new data, rather than relying on training the
model on the same data that it is evaluated on. This evaluation
method helps to determine the model’s generalization
capability and robustness, which are essential for real-world
forecasting applications, where the future data distribution is
unknown.
Results of the Benchmarking
Study for sMPAE
It’s important to note that a lower sMPAE % is good & a
higher sMAPE % is not good. Also, the # of analysts is our
estimate of how many analysts would be needed for the investment
banks to create such forecasts. Of course with preZint there would be
none needed to create these forecasts.
higher sMAPE % is not good. Also, the # of analysts is our
estimate of how many analysts would be needed for the investment
banks to create such forecasts. Of course with preZint there would be
none needed to create these forecasts.
The # of analysts needed will become more relevant later when
we calculate potential cost savings when using preZint to output
forecasts.
we calculate potential cost savings when using preZint to output
forecasts.

As you can see for every data source & every financial KPI forecast
DeepFeatTimeGPT far outpeformed these top investment banks.
And, this is just the current model’s performance. At preZint we are
constantly working on improving this & are other 7 models which
we call AI engines.
DeepFeatTimeGPT far outpeformed these top investment banks.
And, this is just the current model’s performance. At preZint we are
constantly working on improving this & are other 7 models which
we call AI engines.
Results of the Benchmarking
Study for Coverage
The below chart is similar to the sMPAE chart. However, this time a
higher % is good & a lower % is not good.
higher % is good & a lower % is not good.
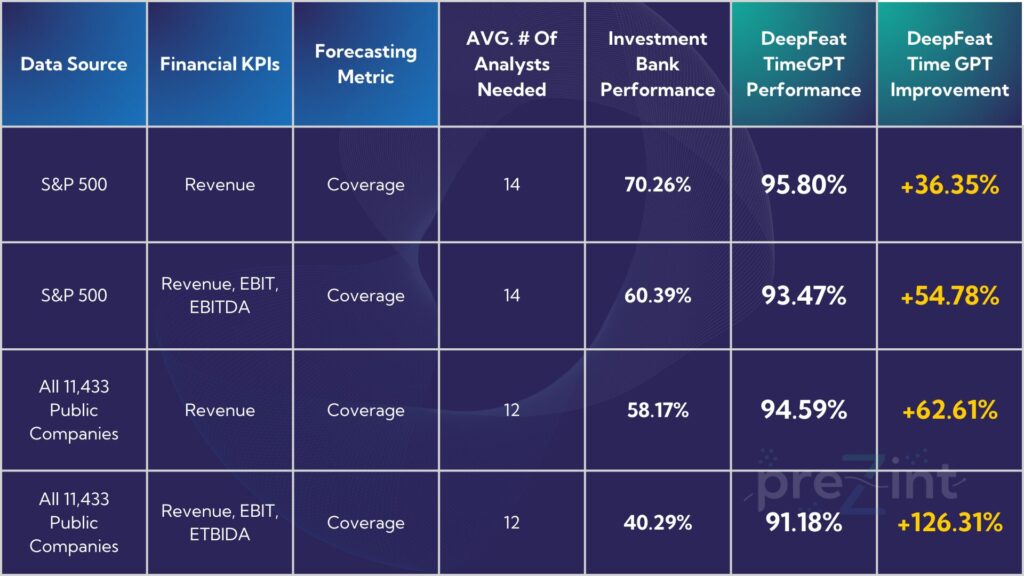
Similar to sMAPE, you can see that in all tests DeepFeatTimeGPT
was able to outperform these investment banks in accuracy by
a wide margin.
was able to outperform these investment banks in accuracy by
a wide margin.
Introducing DeepFeatTimeGPT
The field of financial forecasting has long been dominated by traditional methods like linear regression models, spreadsheets,
and manual work. However, recent advancements in deep learning
have opened up new possibilities for more accurate and efficient
forecasting.
One such innovation is DeepFeatTimeGPT, a multimodal,
probabilistic forecasting system based on a neural network
architecture.
What Sets DeepFeatTimeGPT Apart
DeepFeatTimeGPT stands out because of its ability to
incorporate multiple data sources and modalities. The
neural network can analyze both structured and unstructured data to generate more accurate predictions.
Moreover, the system is probabilistic, providing a range of
possible outcomes and their associated probabilities, rather than a single-point estimate, thereby accounting for uncertainty.
The Training Data
DeepFeatTimeGPT is built on a massive dataset consisting of
nearly 1 billion months of financial history from 1,500,000
companies in 47 sectors and 744 industries across 100
countries. This data includes 78 different measures, such
as revenue, EBITDA, gross margin, and enterprise value.
To put this into perspective, it would take a human over 72 years
of nonstop reading 24/7 to go through all the data. Assuming an average of 1,716 hours of work per year, it would take about 371
working years to read through the dataset.
If a consulting firm charged $250 per hour to do this research, the cost would be approximately $159,225,000. This cost only
accounts for the time spent reading the data and does not include
understanding and interpreting the information.
Benchmarking Study
To assess the effectiveness of DeepFeatTimeGPT compared to traditional methods used by business strategy consultants
or investment banks, we conducted a benchmarking study using
a dataset of published forecasts by investment banks. The dataset
includes forecasts for three central financial metrics:
- Revenue: Total money earned from sales of products or services.
- EBITDA (Earnings Before Interest, Taxes, Depreciation, and Amortization): Measures operating performance by subtracting operating expenses from revenue.
- EBT (Earnings Before Taxes): Measures operating performance by subtracting all operating expenses, including depreciation and amortization, from revenue but before taxes.
The dataset consists of 407,500 data points for 11,443 public companies across 70 countries, 47 sectors, and 209 industries.
The number of investment banks included ranges from 2 to 49, with
a median of 12. Each forecast is provided for four quarters into the
future, with data ranging from Q1/1992 to Q4/2022.
The forecasts are constructed as 95% confidence intervals with
expected (median), lower (5%), and upper (95%) values. To evaluate DeepFeatTimeGPT’s performance, we created several subsets for
analysis, including all 11,443 companies and a subset of S&P 500 firms.
The included investment banks in the study can be found below:
Evaluation Metrics for DeepFeatTimeGPT
We evaluated the performance of DeepFeatTimeGPT using two
central performance measures for forecasting: sMAPE and
coverage.
sMAPE (Symmetric Mean
Absolute Percentage Error)
sMAPE is an accuracy measure based on percentage errors.
It is calculated as the mean of the absolute differences between the actual and predicted values, divided by the sum of the absolute
values of the actual and predicted values, multiplied by 200%. The
median forecast is used for calculating the sMAPE.
Coverage
Coverage refers to the proportion of times that a prediction interval contains the actual outcome. A prediction interval is
a range of values that an event or outcome is expected to fall
within with a certain degree of probability. In probabilistic forecasting,
coverage is an important metric for assessing the accuracy and
reliability of the forecast model.
Evalutation Setting
DeepFeatTimeGPT is evaluated through zero-shot testing,
meaning that the model is tested on a data series it has not encountered previously. During the benchmark study, the
model sees the data from the companies for the first time.
The purpose of this approach is to evaluate the model’s ability to generalize to new data, rather than relying on training the
model on the same data that it is evaluated on. This evaluation
method helps to determine the model’s generalization
capability and robustness, which are essential for real-world
forecasting applications, where the future data distribution is
unknown.
Results of the Benchmarking Study for sMPAE
It’s important to note that a lower sMPAE % is good & a
higher sMAPE % is not good. Also, the # of analysts is our estimate of how many analysts would be needed for the investment
banks to create such forecasts. Of course with preZint there would be
none needed to create these forecasts.
The # of analysts needed will become more relevant later when
we calculate potential cost savings when using preZint to output forecasts.
As you can see for every data source & every financial KPI forecast DeepFeatTimeGPT far outpeformed these top investment banks.
And, this is just the current model’s performance. At preZint we are
constantly working on improving this & are other 7 models which
we call AI engines.
Results of the Benchmarking Study for Coverage
The below chart is similar to the sMPAE chart. However, this time a higher % is good & a lower % is not good.
Similar to sMAPE, you can see that in all tests DeepFeatTimeGPT
was able to outperform these investment banks in accuracy by a wide margin.

Book Your Demo
Fill out the form to book your demo
Click green button when done to be directed
to the calendar reservation page.
Your privacy is of our upmost concern. We will not share your information with any third parties. You can request that we delete your information at anytime.
Demo Is
What?
Your demo is the next step creating your customized preZint solution.
Below are some of the key points of the demo.
Below are some of the key points of the demo.
Questionnaire
Complete a questionnaire to understand
your companies specific & unique challenges
your companies specific & unique challenges
Benefit: Tailored insights to ensure
your demo addresses your exact needs
your demo addresses your exact needs


Scheduling
After questionnaire, reserve a date / time for demo.
Demo is held at your office or desired location
Demo is held at your office or desired location
Benefit: See preZint live in person
Live Demonstration
A sales representative & product specialist
will conduct a live demo at your desired location
will conduct a live demo at your desired location
Benefit: See for you industry how preZint
can reduce operational costs by 30%
can reduce operational costs by 30%

Book Your Demo
Fill out the form to book your demo. Click green button when done to be directed to the calendar reservation page.
Your privacy is of our upmost concern. We will not share your information with any third parties. You can request that we delete your information at anytime.
Demo Is
What?
Your demo is the next step creating your customized preZint solution.
Below are some of the key points of the demo.
Questionnaire
Complete a questionnaire to understand
your companies specific & unique challenges
Benefit: Tailored insights to ensure
your demo addresses your exact needs
Scheduling
After questionnaire, reserve a date / time for demo.
Demo is held at your office or desired location
Benefit: See preZint live in person
Live Demonstration
A sales representative & our expert will conduct a live demo at your desired location
Benefit: See for you industry how preZint can reduce operational costs by 30%